
From Scans to Strategy: How a Global Conference Unlocked Powerful recaps with Data Visualization on Airtable Interfaces
- Katelyn LeBoeuf
- Jun 4, 2025
- 2 min read

From Manual Mayhem to Modern Reporting
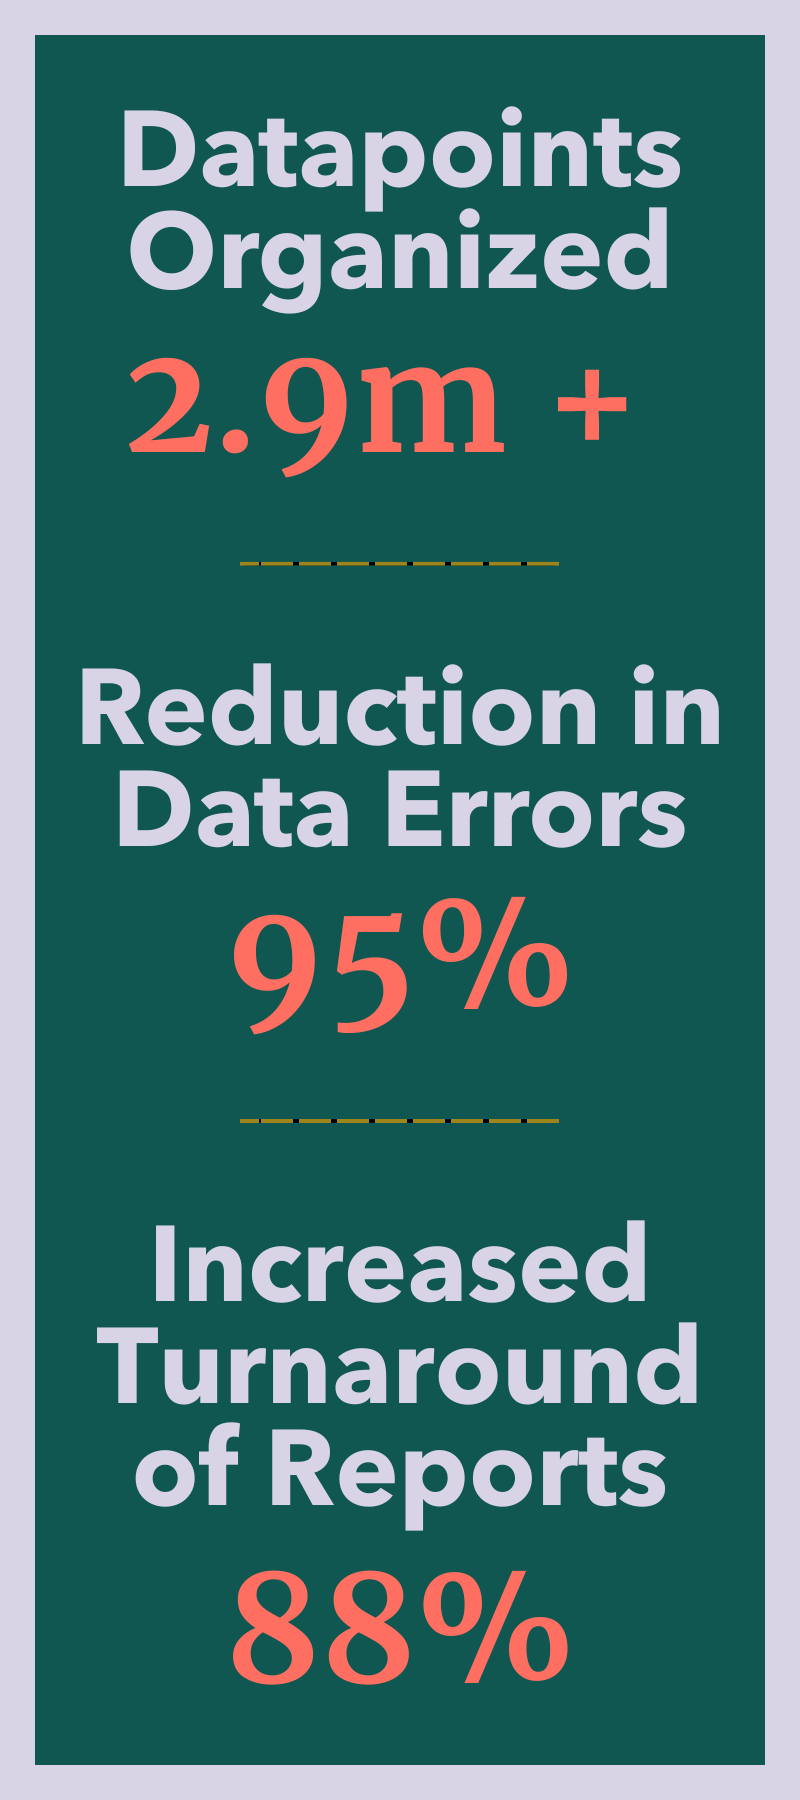
An established conference hosting over 400 events annually, attracted diverse audiences and sponsors demanding detailed, accurate reporting. With 20,000+ attendee engagement records, the team relied on manual Google Sheets processes — leading to inefficiencies, data inconsistencies, and limited analytical capabilities. With growing demands from stakeholders for detailed demographic and participation insights, they needed a robust yet flexible system to streamline operations and enhance data reliability.
Growth was stifled by outdated workflows, making a modern, integrated solution not just a preference but a necessity.The existing process was unsustainable—disconnected demographic data, inconsistent event labels, duplicate records, and a reliance on copying over 25,000 scan results by hand. These inefficiencies limited the conference’s ability to deliver timely, accurate reports, hampering sponsor satisfaction and internal decision-making.
Transforming Event Data into Action with Data Visualizations on Airtable Interfaces
By focusing on simplicity, scalability, and user adoption, a solution emerged. Airtable and its dashboard interfaces offered a low-code, cost-effective platform that could consolidate complex datasets without overwhelming the team. The custom interface ensured users only saw relevant information, reducing friction and accelerating adoption. This approach not only solved immediate challenges but also provided a flexible foundation for future data initiatives.
The Objective: Designing for Accuracy, Efficiency, and Insight
🔸 Establish a centralized, relational database to connect attendee data with RFID event participation
🔸 Provide intuitive dashboards for internal teams and sponsors to access real-time insights.
🔸 Enable scalable reporting processes to support continued conference growth.
The Solution: Turning Today’s Data into Tomorrow’s Advantage
A suite of services was designed to transform reporting capabilities focused on data integrity, usability, and insightful analysis. By integrating Airtable dashboards with customized, scalable workflows, I helped this global conference shift from data chaos to strategic clarity, proving that when systems are designed with purpose, they don’t just solve problems. They create pathways for growth.
Unlocking the Lasting Value of Connected Data
Meticulous systems design and precision-driven aggregation logic turned scattered data into a strategic powerhouse—demonstrating that when every formula, every field, and every connection is engineered with intent and mastery, businesses don’t just get cleaner data; they unlock new levels of clarity, growth, and strategic agility.
Scalable Reporting Framework
A flexible system was designed to expand with the conference’s evolving needs, ensuring new data and future initiatives could be supported without starting from scratch.
Actionable Insights Through Visualization
Comprehensive dashboards made complex datasets easy to interpret with data visualizations on Airtable Interfaces, empowering quicker, data-driven decisions around attendee behavior, event performance, and engagement.
Maximized Trend Analysis
Clean, relational data enabled the team to identify patterns across demographics, event types, and participation rates—transforming raw information into valuable strategic insights.


Comments